 |
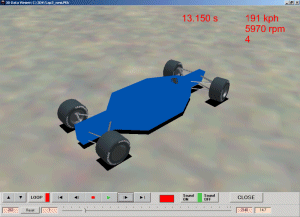
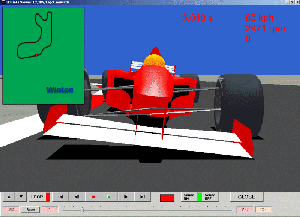
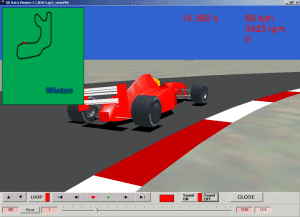
The program displays vehicle
data in the form of a 3D model on the computer
screen, moving in real time. Suspension motion is
displayed, as is steering position and basic
vehicle data (speed, engine rpm, time and current
gear).
|
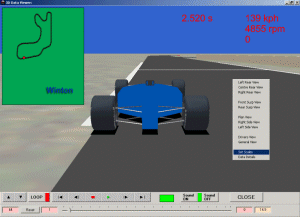 |
An on-screen menu enables
the selection of a number of predefined view
points as well as providing access to data
displays and a number of setup parameters.
|
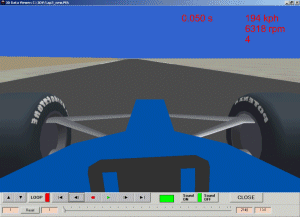 |
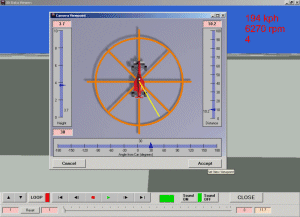
A "driver's eye"
view is available, showing the driver's
perspective and steering inputs, both at the
steering wheel and the vehicle's front wheels.
|
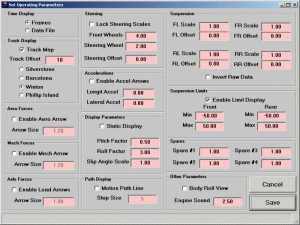 |
This is the vehicle setup
screen. It enables a variety of options to be
applied. Scaling factors can be applied, and
altered, to exaggate the steering and suspension
motions for clearer viewing. Static and dynamic
vehicle display modes can also be set.
|
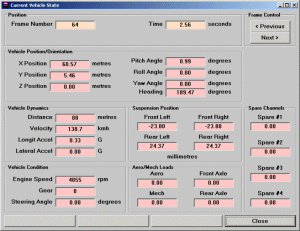 |
This
is the data display screen. This provides all
vehicle data for the current time period. The
data can be stepped, frame by frame, to see how
parameters are varying.
|
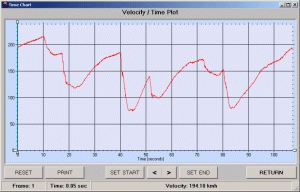 |
The
vehicle data can also be displayed in the form of
a time chart, showing the data variation with
time, for all available data. Separate charts are
available for about two dozen different
parameters at present.
|
 |
If
none of the predefined viewpoints suits your
requirements, a user-defined viewpoint can be set
interactively within the program.
|
 |
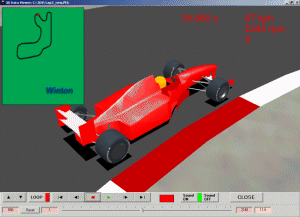
Viewpoints
have been predefined for both the front and rear
suspension. Suspension motion is typically scaled
to make any movements very obvious. Steering
inputs can also be handled in this way.
|
 |
Suspension
and steering values can have both a scale factor
and an offset applied. The suspension motion can
also be inverted, to cater for different
instrumentation arrangements.
|
 |
A
suspension travel limit can be implemented. When
the suspension exceeds a certain user-defined
value (positive or negative) the suspension top
link will change colour to indicate this
condition has been met or exceeded.
|
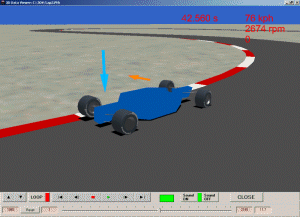 |
Force
and balance arrows are available to indicate
visually the variation of the vehicle's
mechanical or aerodynamic balance, and the
relative forces on the front and rear axles.
|