Estimation
of The Drag of a Roof Mounted Antenna
(Ford AU Falcon)
|
|
1.
Introduction
With the increasing use of telemetry and in-car radio
communication in motorsport, a variety of radio antennas are now
being fitted to racing cars. This report will consider the
potential aerodynamic impact of a radio antenna mounted on the
roof of a Ford AU Falcon V8 touring car. The AU Falcon was chosen
as geometric data for the car body profile was available to us.
The particular case being considered here is for a typical V8
Supercar. These vehicles tend to operate with two antennas
mounted on the roof. There is usually a larger main antenna
mounted in the centre of the roof panel and a smaller antenna
mounted half to one metre behind the main antenna. Previously the
main antenna was about 300 mm in length and quite rigid, but
there now appears to be a move toward using a much longer, more
flexible component.
As a general comment, placing an antenna in the centre of a car's
roof panel represents a very favourable location as far as the
performance of the antenna is concerned with respect to radio
communication, but this location would be the worst possible
location aerodynamically. The air flowing over a car roof is
travelling faster than the speed of the car itself. Aerodynamic
drag varies with the square of velocity, so the current antenna
location is possibly one of the highest drag locations on the
whole car body.
2.
Theory
The underlying theory for this analysis relates to the behaviour
of a cylinder in an air flow. The amount of drag generated by a
cylinder will vary greatly depending on the relative size of the
cylinder and the speed of the air.
These values are related by using a parameter called Reynold's
Number (Re). This is a dimensionless value which correlates fluid
behavior for different object sizes and flow speeds. Regardless
of an object's physical size and the speed of the air flowing
past it, if two objects have a similar Reynold's Number then the
nature of the flow around them will be very similar.
The behaviour of a cylinder in an air flow will vary greatly with
the Reynold's Number. It has been determined experimentally that
below a Reynold's Number of 1.5 x 10^5 you have what is called
"sub-critical" flow, and a typical cylinder will have a
drag coefficient value of about 1.20, while above a Reynold's
Number of 4 x 10^5 you will have what is called
"super-critical" flow, with a drag coefficient value of
about 0.40. Between these ranges there is a transition region.
The simple relevance of this is that in
"super-critical" flow the drag of the cylinder will be
one-third that of the same cylinder operating in
"sub-critical" flow.
This situation is not dissimilar to that of the golf ball. A golf
ball with a smooth surface was found to operate within a certain
Reynold's Number region, with a particular drag. By applying a
rough surface to the golf ball (the well known golf ball dimple
pattern) it was found the flow around the ball changed, and so
operated in a region with lower drag. The nett result was better
performance through achieving this lower drag level.
The reason for the variation in drag between
“sub-critical” and “super-critical” flow
relates to the wake generated when the air flows past a cylinder.
The nature of the wake changes as the Reynold's Number increases.
This involves the mix of laminar and turbulent flow of the
passing air, and the point on the cylinder's surface where the
laminar flow changes to turbulent flow.
Another feature to be considered is what is termed a "Karman
Vortex Street". Under certain conditions vortices can be
shed by the flow passing a cylinder. These vortices are generally
shed in an ordered manner, from each side of the cylinder's
surface, in turn. The nett result of this is that an oscillation
can be set up, caused by these fluctuating forces on the
cylinder. This process is the basis for wires sometimes
"singing" when acted on by a wind of an appropriate
velocity.
For the calculation of Reynold's Number and drag for a cylinder
we base the cylinder size on its diameter, and its reference area
(for drag calculations) on its frontal area (length x diameter).
 |
3.
Analysis
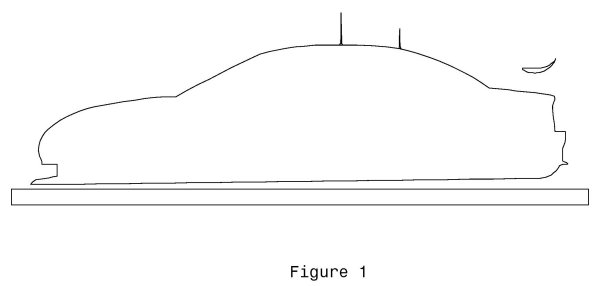
We can now perform a a theoretical analysis in order to estimate
the likely drag of an antenna mounted on the car roof. A general
view of the Falcon centreline body profile, and the typical
antenna locations, is shown in Figure 1.
A racing car does not usually operate at a single speed, but over
a speed range. We have assumed a speed range here from 128 km/h
(80 mph), as the low end, up to 272 km/h (170 mph), as the high
end, with 200 km/h (125 mph) as the average. We will perform
calculations for all three speeds, so we can see how the various
parameters may vary over this speed range.
We also need to define a typical antenna geometry, or two in this
analysis. We will first consider a shorter, rigid antenna,
typical of the older style. We will assume here an antenna length
of 300 mm and a diameter of 8 mm, with a circular cross-section
(as shown in Figure 1).
The Reynold's Number can be calculated, for velocity in metres
per second and the reference length in metres, using the
following equation;
| Re = (velocity x length) / 1.456 x 10^-5 |
Here we have a reference length of 0.008 metres (the diameter of
the antenna). Using these values we can calculate the following
Reynold's Numbers for the speed range being considered;
| 80 mph = 128 km/h = 35.5
m/sec giving Re = 1.95 x 10^4 125 mph = 200 km/h = 55.5 m/sec giving Re = 3.05 x 10^4 170 mph = 272 km/h = 75.5 m/sec giving Re = 4.15 x 10^4 |
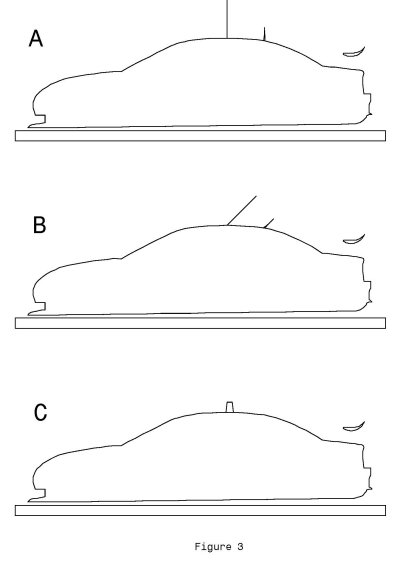
We can now consider a second case of an antenna twice as long
(600 mm) but with only half the diameter (4 mm). This is intended
to represent the more modern type of "whip" antenna now
being used (as shown in Figure 3, Item A).
As before, for the Reynold’s Number calculation, our
reference length is now 0.004 metres and we obtain;
| 80 mph = 128 km/h = 35.5
m/sec giving Re = 9.75 x 10^3 125 mph = 200 km/h = 55.5 m/sec giving Re = 1.52 x 10^4 170 mph = 272 km/h = 75.5 m/sec giving Re = 2.07 x 10^4 |
For both the geometries considered here the effective Reynold's
Number range is between 1.0 x 10^4 and 4.0 x 10^4, which is well
into the "sub-critical" drag range for a circular
cross-section. For Reynold's Numbers below 1.0 x 10^5 the drag
coefficient for a cylinder is around 1.10 to 1.20 (depending on
the particular reference source consulted).
From this we can now make an estimate of the aerodynamic drag.
Aerodynamic drag is given by the equation;
| Drag = Cd x S x 0.5 x rho x Velocity^2 |
where "Cd" is the drag coefficient (Cd being 1.10
here), "S" is the reference area (0.3 x 0.008 = 0.6 x
0.004 = 0.0024 square metres, and the same for both geometries
being considered) and "rho" is the air mass density
(1.225 kg/m^3). From this we can now estimate the following drag
values;
| 80 mph = 128 km/h = 35.5
m/sec giving Drag = 2.04 Newtons 125 mph = 200 km/h = 55.5 m/sec giving Drag = 4.98 Newtons 170 mph = 272 km/h = 75.5 m/sec giving Drag = 9.22 Newtons |
Oscillation
Frequency
It is also possible to estimate the possible oscillation
frequency of the antenna. This can be calculated using the
equation;
| frequency = (velocity x SN) / length |
where the velocity is in metres per second and the length is the
reference length (diameter of the antenna) measured in metres.
The value SN is termed the Strouhal Number, and for the flow
conditions here it has an approximate value of 0.185 (obtained
from graphs of experimental data).
From this we find the 8 mm diameter antenna has an oscillation
frequency of 821 hertz at 35.5 m/sec (128 km/h), increasing to
1746 hertz at 75.5 m/sec (272 km/h). Similarly, the 4 mm diameter
antenna has an oscillation frequency ranging from 1642 hertz to
3492 hertz.
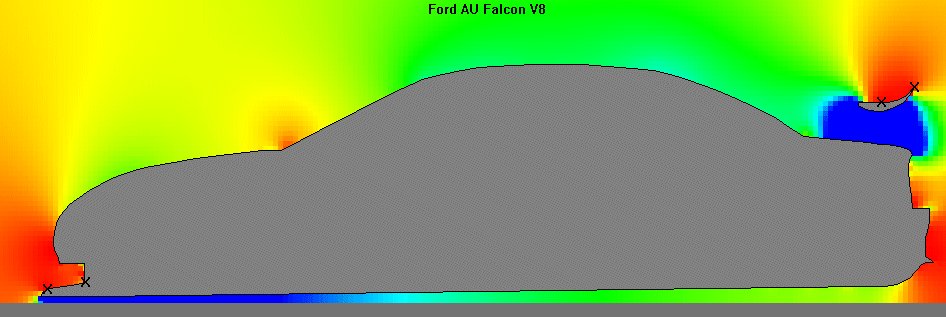 |
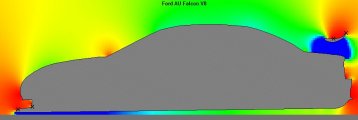
Pressure
Distribution
As a step in better understanding the airflow and pressure
distribution around the vehicle body, the body centreline profile
was entered into a 2D computational fluid dynamic analysis
program (SUB-2D). The results of this analysis are shown in
Figure 2.
The key point arising from this analysis is that the local
airflow over the roof of the car has a much higher velocity than
the freestream velocity. This was determined theoretically as
being 38 percent higher, though in reality this may be more like
25 percent, as the theoretical analysis did not take into account
viscous effects and other real-World interactions.
On this basis, for our drag calculation of air passing the
antenna at 75.5 metres per second (272 km/h), the actual vehicle
speed would have been slower, as the airflow over the roof is a
locally accelerated flow with a value above the vehicle's road
speed, by about 25 percent. Therefore the vehicle would probably
have been travelling at about 60.5 m/sec (218 km/h) in this
situation.
4.
Conclusions
The key question arising out of this report is, just how
important is drag reduction in optimising the performance of a
racing car? The aerodynamic drag of the antenna is quite small,
but it is a clear source of energy loss. There are a variety of
ways in which this drag can be reduced, but to achieve this will
involve some cost and effort. The amount of effort will also
inevitably be a trade-off between the required radio performance
and the reduction of aerodynamic drag.
The actual antenna installations are likely to have much higher
drag than that calculated here. This analysis only estimated the
drag of the central antenna rod. Real antenna installations
involve a mounting bracket on the car roof and, in some cases, a
thicker fitting part way along the antenna itself. Most cars also
have a second, smaller antenna mounted behind the main unit. On
this basis a real installation may have up to four times the drag
calculated here. The actual drag will vary between cars as the
antenna mounting fixtures can vary widely in their shape and
location.
 |
5.
Recommendations
There are a number of options available which could reduce the
drag of a roof mounted antenna. It's important to note that the
suggestions here are aimed at reducing aerodynamic drag but take
no account of the effect on antenna performance as it relates to
radio reception or transmission.
Perhaps the simplest option is to rake the antenna back at an
angle (see Figure 3, Item B). As the angle is increased the
effective cross-section of the antenna changes from a circle to
an ellipse of increasing fineness. The drag coefficient of an
ellipse is lower than for a circle of similar width, so this
would provide a small aerodynamic advantage for minimal effort.
A second option would be to streamline the antenna rod. Changing
the antenna from a circular cross-section to a streamline
cross-section (a teardrop shape having the same width as the
circular antenna, and a thickness-to-chord ratio of 25 percent)
would reduce the drag coefficient from a value of about 1.10 to a
value of about 0.70 (about a 35 percent drag reduction).
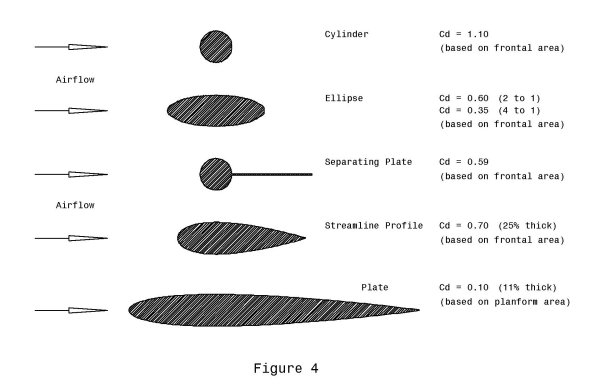
Changes to the cross-section other than by using a streamlined
profile can also be usefully employed. Several options are
presented in Figure 4.
Changing the antenna from a long thin cylinder to a broad plate
is also a possible option (Figure 3, Item C), assuming the radio
performance is not adversely affected by this arrangement.
In this case we can estimate the drag of such a plate,
representing some theoretical antenna, 140 mm in height and 70 mm
in width (the direction aligned with the airflow). We can assume
an 11 percent thick aerofoil type cross-section, which, at a
velocity of 75.5 m/sec (272 km/h) would have a Reynold's Number
of 3.63 x 10^5, giving a drag coefficient (based on the planform
area) of 0.10. The planform area would be;
| 0.07 x 0.14 = 0.0098 square metres |
Calculating the drag of this item gives us a value of 3.42
Newtons, compared to the 300 mm/600 mm antenna drag, at the same
speed, of 9.22 Newtons. This example has been included primarily
to highlight how a properly streamlined profile can offer
dramatically lower drag than a circular cross-section, even if it
has a much greater surface area.
There is also the potential to reduce drag by mounting the
antenna on a different location on the car body. The roof is a
location where the local air speed is quite a bit higher (a low
pressure region) than that of the free stream airflow surrounding
the car. Moving the antenna to the rear edge of the bonnet, where
the local air velocity is slower (a higher pressure region), or
to the boot lid, where the airflow is very turbulent and
disturbed, should result in a measurable drag reduction. The
disadvantage of this approach is that the radio signal may be
blanketed from the antenna for some directions.
 |
6.
References
(1) Fluid Dynamic Drag - S F Hoerner Published by the author 1965 (2) Aerodynamics, Aeronautics & Flight Mechanics Barnes W McCormick John Wiley & Sons 1979 (3) Further Aerodynamics for Engineering Students Houghton & Boswell Edward Arnold Ltd 1969 (4) Pratt & Whitney Aeronautical Vest-Pocket Handbook Eighteenth Edition June 1978 (5) SUB-2D for Windows Version 1.06 SoftwAeronautics, Inc |
This report was prepared by Temporal Images in support of a development project being undertaken by presspley sports design. September 2005 |